View Cluster Information
Steps
Access
http://<ip>:8080/to log into the DBCC console.Click Dashboard in the left navigation menu to view the cluster overview.
Display item
Description
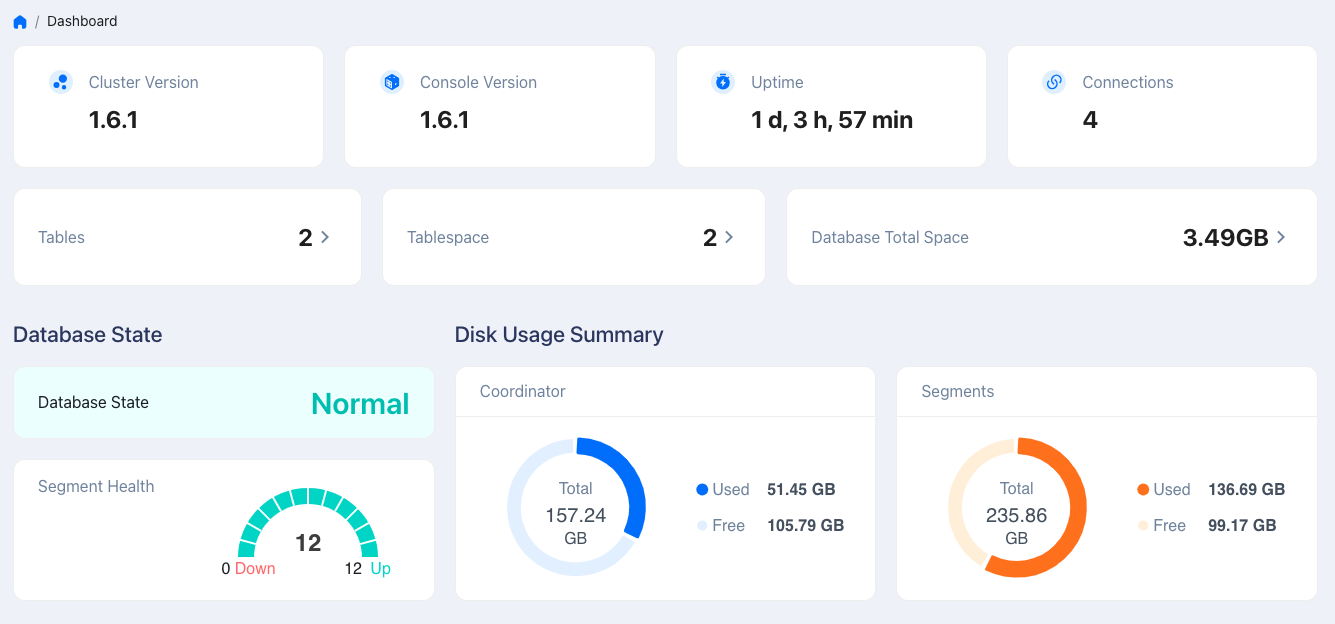
Overview
Cluster version, console version, cluster uptime, the number of cluster connection sessions, total number of tables, number of tablespaces, and total disk in use. Note that some metrics contain a detailed page. Click on the metrics to view more.
Database State
The overall status of the database and the number of normal and abnormal segments.
Disk Usage Summary
Disk usage of the coordinator and segments.
Display item
Description
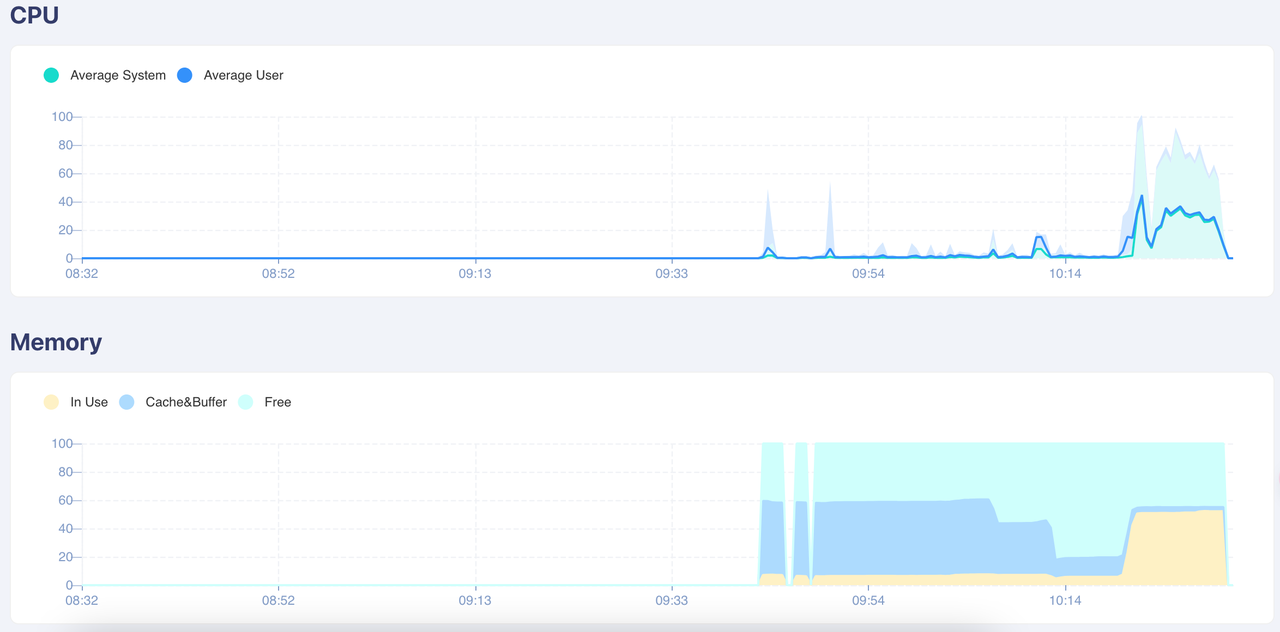
CPU
Shows the average CPU and maximum CPU usage of the cluster in the past 2 hours. - The orange and blue lines represent the system processes and user processes, respectively. Click the legend in the upper left corner to show or hide the line. - Hover the cursor over the chart to display the CPU usage percentage at specific time points.
Memory
Shows the average memory usage percentage of the cluster in the past 2 hours. - Hover the cursor over the chart to display the average memory and maximum memory usage percentage at specific time points.
Note
DBCC supports monitoring multiple database clusters. You can switch between clusters using the dropdown menu in the top-right corner of the console.